


Microsoft Power BI

Power BI consultancy for UK and European organisations

We unify sources, build a reliable semantic model and design reports that answer real management and operations questions.

Decision
KPI with context
Automatic
updated data
By role
governed access
Leadership team analysing business metrics on screen
From operational data to a decision that arrives on time.

Power BI works when everyone trusts the same number.

We connect ERP, CRM and Excel, clean the data with Power Query and define each KPI only once before building the dashboard.

Data that already existsERP · CRM · Excel
Power Query + DAXA common ruleThe data is cleaned and the KPI is defined only once.
Operating margin18,4%The same figure for management and operations.
A reliable source. A definition. A shared decision.

Reliable data

First we sort the data. Then we build the dashboard.

01

Power Query gathers and cleans

Connect the sources and leave each transformation documented and repeatable.

02

DAX defines the indicator

The KPI formula is written once and used in all reports.

03

The semantic model is shared

Management and operations consult the same definition, with access based on their role.
Experience and intelligence

From dashboard to natural language, without losing context.

04

Microsoft Fabric

Lakehouse, pipelines and governance when volume or architecture requires a unified platform.

05

Security and distribution

Row-level security, apps, subscriptions, alerts and mobile access according to each audience.

06

natural language

Agents and chatbots that query models and data lakes using MCP with contextualized responses.

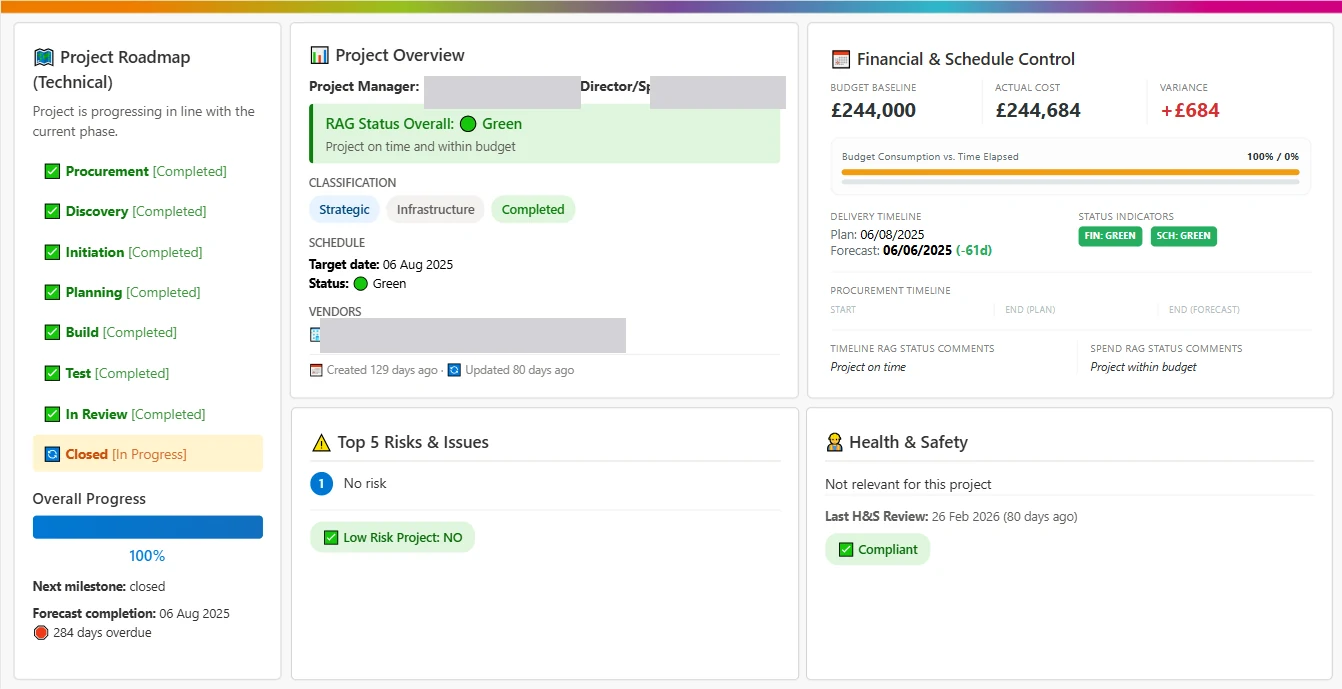
Live Power BI dashboard used by an operations team
Real information, presented to the person who must act.

Data that is already helping to decide.

Executive and operational reporting designed to be maintained, scaled and used every week.

Power BI

From recurring reports to accessible intelligence.

The model becomes the common basis for dashboards, alerts, documents and conversational agents.

Ports and logistics / United Kingdom

Executive dashboards

Activity, service and performance brought together for management and operations.

Telecommunications / Multicountry

Multi-country consumption panel

Comparable billing and usage by country with recurring update.

Finance / Spain

Automatic account statements

Consolidated data and documents distributed without monthly preparation.

Corporate services / Spain

Recurring reporting

Reports that are updated and distributed with a stable definition.

Media and audiences / Spain

Audience alerts

Warnings when an indicator leaves the agreed range.

Data and AI / Spain

Chatbots on data lakes using MCP

Natural language queries on governed data with context.

Port operation connected to Power BI reports

The essentials about Power BI.

Talk to an expert
Can you improve an existing Power BI?

Yes. We audit model, DAX, Power Query, performance, security and experience before prioritizing improvements.

What is the difference between a dashboard and a semantic model?

The dashboard presents information. The semantic model defines relationships, measurements and meaning so that all reports use the same data.

Do you work with Microsoft Fabric?

Yes. We design lakehouses, pipelines, semantic models and governance when Fabric is the appropriate architecture.

Can you create chatbots connected to Power BI or a data lake?

Yes. We use agents, MCPs and access controls to consult data in natural language without losing traceability.

What decision is still waiting for someone to prepare the report?

In a diagnostic session we will review sources, model, audiences and the first indicator that must be automated.